We are happy to announce the open source release of Lagoon. Jointly developed with Pfizer, Lagoon is a tool for centralizing semi-structured datasets like CSV or JSON files into a data “lagoon”, where your data can be easily versioned, queried, or passed along to other ETL pipelines.
If you’ve ever worked to extract meaning from collections of disparate CSV or JSON files, you’ll know that one of the most tedious and labor-intensive steps in this process is mapping their structure and contents into a common storage location so that they can be joined and queried easily. We wrote Lagoon to do this part of the job for you.
The primary component of Lagoon is its server which is layered on top of a PostgreSQL database. Lagoon automatically generates database schemas for your datasets, allowing you to directly ingest them into the Lagoon store without having to manually configure tables. Data is queryable via a REST API, client libraries, or directly in PostgreSQL via automatically generated SQL views.
While other tools like Apache Drill also support querying CSV and JSON files, they typically require the user to manually specify types for data stored in text-based formats. Lagoon’s type inference simplifies the process of querying these datasets, and since data is ingested into a centralized relational database, it’s easier to integrate that data with traditional ETL tools. Lagoon also supports dataset-level versioning, enabling you to store and query multiple versions of your datasets as you wrangle your data.
Example
Let’s try it out! As a simple example, we can ingest and query a few sample datasets from the NOAA Storm Events Database, which contains a record of major storm events in the United States over the past century. Comprising a large set of CSV files with several different schemas, the Storm Events Database provides a good case study for Lagoon’s data ingestion capabilities. It will also allow us to try out Lagoon’s query interface to incorporate that data into a data analysis workflow in Python.
In this example, we will:
- Start up a Lagoon server and database backend using Docker and Docker Compose.
- Ingest a few example files into our new lagoon using the lagoon-client Docker image.
- Query and plot some data from our newly ingested storm datasets using PyLagoon, Lagoon’s Python client library.
1. Create a new lagoon
We can create a local lagoon-server instance using the Docker Compose file that is included in the GitHub repository. This file also specifies
a container for the lagoon-server’s PostgreSQL backend.
$ git clone [email protected]:tweag/lagoon.git
$ cd lagoon/docker
$ docker-compose up
2. Ingest example datasets
Now that the lagoon-server instance is running, we can ingest some example datasets.
One easy way to ingest data is via the lagoon-client Docker image.
Let’s take a look at the storms from 2019. The CSV files in this example can be downloaded from the NOAA storm events file server.
As a first example, we can ingest the storm details dataset:
# Note: this command assumes you've downloaded the csv files to your working directory
$ docker run --network="host" --volume "$PWD/StormEvents_details-ftp_v1.0_d2019_c20200716.csv:/StormEvents_details-ftp_v1.0_d2019_c20200716.csv" \
    tweag/lagoon-client --port 1234 --host localhost ingest --name "storm_details_2019" /StormEvents_details-ftp_v1.0_d2019_c20200716.csv
This is a long command, so let’s take a closer look at what we are actually doing. In the first line we are specifying options for the Docker container. We specify that: 1) we want the lagoon-client container to be able to communicate with the lagoon-server we started earlier which is running on the host network, and 2) we want to mount the input CSV file to the container to make it visible to the Lagoon client.
In the second line, we invoke the lagoon command line client’s ingest command on the storm details CSV file, specifying that the lagoon-server is listening to port 1234 on our local host. We also use the --name flag to give the new dataset a human-readable identifier which can be used when querying it later.
The output from the ingest command describes the schema that was generated for the newly ingested dataset:
storm_details_2019 (version 1)
URL         (local)
description storm_details_2019
tags        (no tags)
created     2020-08-21 08:48:03.583204579 UTC
added by    unauthenticated-user
deprecated  False
schema      demo
table       t1 (with view storm_details_2019_v1)
typed       typed1 (with view storm_details_2019_v1_typed)
row count   67506
columns
        Type	Name
    c1	INTEGER	BEGIN_YEARMONTH (BEGIN_YEARMONTH)
    c2	INTEGER	BEGIN_DAY (BEGIN_DAY)
    c3	INTEGER	BEGIN_TIME (BEGIN_TIME)
    ...
    c9	TEXT	STATE (STATE)
    ...
    c13	TEXT	EVENT_TYPE (EVENT_TYPE)
    ...
    c45	TEXT	BEGIN_LAT (BEGIN_LAT)
    c46	TEXT	BEGIN_LON (BEGIN_LON)
    ...
Something to keep in mind is that type inference has its limits and will sometimes result in an inconvenient or unexpected type.
For example, the generated BEGIN_YEARMONTH column contains values like “201907” representing July 2019.
This value was stored as an INTEGER which makes it harder to use to construct a DATE value than if it was stored as text.
For this reason, Lagoon also always generates an “untyped” SQL view which can be used to access raw values (storm_details_2019_v1 in the example above).
You can disable type inference entirely using the ingest command’s --no-type-inference flag. Disabling type inference will stop Lagoon from generating
typed views and make Lagoon queries return data in a raw format (text for delimited text sources and JSON strings for JSON sources).
We can run a similar ingest command to ingest the 2019 storm fatalities dataset:
$ docker run --network="host" --volume "$PWD/StormEvents_fatalities-ftp_v1.0_d2019_c20200716.csv:/StormEvents_fatalities-ftp_v1.0_d2019_c20200716.csv" \
    tweag/lagoon-client --port 1234 --host localhost ingest --name "storm_fatalities_2019" /StormEvents_fatalities-ftp_v1.0_d2019_c20200716.csv
3. Query the lagoon
With our data ingested, we can start querying data using PyLagoon and analyze it using some standard data science tools in Python. The first step is to initialize the client.
from PyLagoon import LagoonConfig, Lagoon

lagoon = Lagoon(
    config=LagoonConfig.load(yaml_file="../docker/examples/lagoon-client.yaml")
)
We can access our datasets using the names we provided when we ingested them (the ingest command’s --name argument).
You can also query all available data sources by omitting the
name argument. It is also possible to query a subset of them by tag
using the tag argument, which I won’t be covering in this post.
details_source = lagoon.sources(name="storm_details_2019")[0]
fatalities_source = lagoon.sources(name="storm_fatalities_2019")[0]
Each source contains a description of its corresponding dataset, but no actual data has been downloaded yet.
To load data into a pandas DataFrame, we can use our lagoon object’s download_query() or download_source() methods.
The storm_details_2019 dataset includes data for over 67,000 storm events. While it is possible to load this entire dataset into a pandas DataFrame on most workstations, with larger datasets we would quickly saturate our workstation’s available memory. One of the advantages to using Lagoon is that we can limit the data we load into memory to only include the data we are interested in by specifying a SQL query. This helps to minimize client resource consumption and allows us to analyze larger datasets than would be possible with pandas alone.
Let’s use this query functionality to examine the storms that happened in the state of Texas in 2019.
from PyLagoon import PGMeta

# Lagoon uses SQLAlchemy for formatting SQL queries: https://www.sqlalchemy.org/
# To construct queries using SQLAlchemy, we need to generate a description of our database schema
meta = PGMeta([details_source, fatalities_source])

# Schemas for our two datasets:
storms = meta[details_source]
fatalities = meta[fatalities_source]

# Note: we can also use the PyLagoon.build_sql_query() function to preview or spot-check our query
query = meta.query(storms).filter(storms.STATE.like("%TEXAS%"))

df = lagoon.download_query(query=query, sources=[details_source])
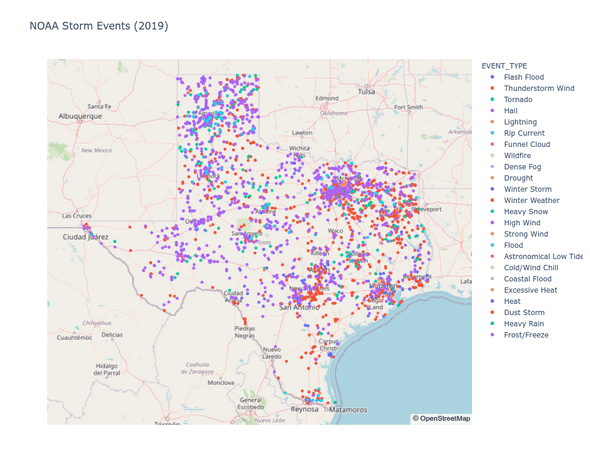
With our query results loaded, we can start working with our dataset. For example, we can map the storms along with their types.
# https://pandas.pydata.org/
# https://plotly.com/python/

import pandas as pd
import plotly.express as px

# It looks like some bad values in the lat/lon columns forced them
# to be stored as strings. We can still cast them to floats (ignoring
# errors) using pandas:
df["BEGIN_LAT"] = pd.to_numeric(df["BEGIN_LAT"])
df["BEGIN_LON"] = pd.to_numeric(df["BEGIN_LON"])

px.scatter_mapbox(
    df,
    lat="BEGIN_LAT",
    lon="BEGIN_LON",
    color="EVENT_TYPE",
    mapbox_style="open-street-map",
    color_continuous_scale=px.colors.cyclical.IceFire,
    size_max=15,
    zoom=4,
    title="NOAA Storm Events (2019)",
    width=1000,
    height=800
).show()

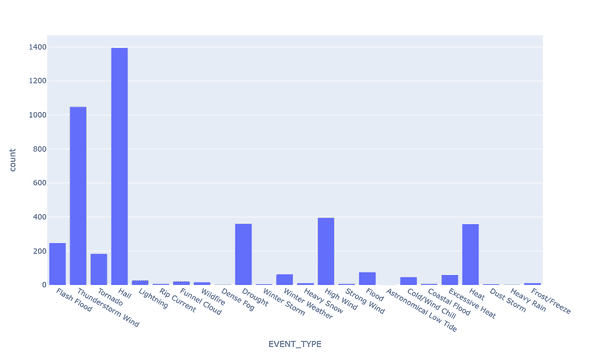
px.histogram(df, x="EVENT_TYPE", width=1000, height=600).show()
It looks like Texas has a lot of hail storms!
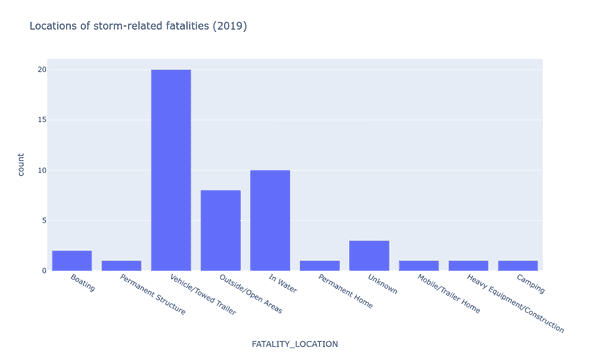
We can also perform more complex queries. For example, we can join our two datasets to see the type of location where the most storm-related fatalities occurred in 2019.
query = (
    meta.query(
        storms.EVENT_ID, storms.BEGIN_LAT, storms.BEGIN_LON, fatalities.FATALITY_LOCATION
    )
    .join(fatalities, storms.EVENT_ID == fatalities.EVENT_ID)
    .filter(storms.STATE.like("%TEXAS%"))
)
df_joined = lagoon.download_query(query=query, sources=[details_source, fatalities_source])

fig = px.histogram(
    df_joined,
    x="FATALITY_LOCATION",
    title="Locations of storm-related fatalities (2019)",
    width=1000,
    height=600
)
fig.show()
With just a few quick commands we were able to ingest new datasets into our lagoon and start analyzing them, all without having to worry about generating database schemas.
Next steps
To get started with Lagoon, check out the documentation on GitHub. The Lagoon server and command line client are available as Docker images on DockerHub, and all components are also packaged using Nix in the GitHub repository.
Thanks for reading, and we hope that Lagoon is able to help streamline your data analysis workflows.
Behind the scenes
If you enjoyed this article, you might be interested in joining the Tweag team.


